

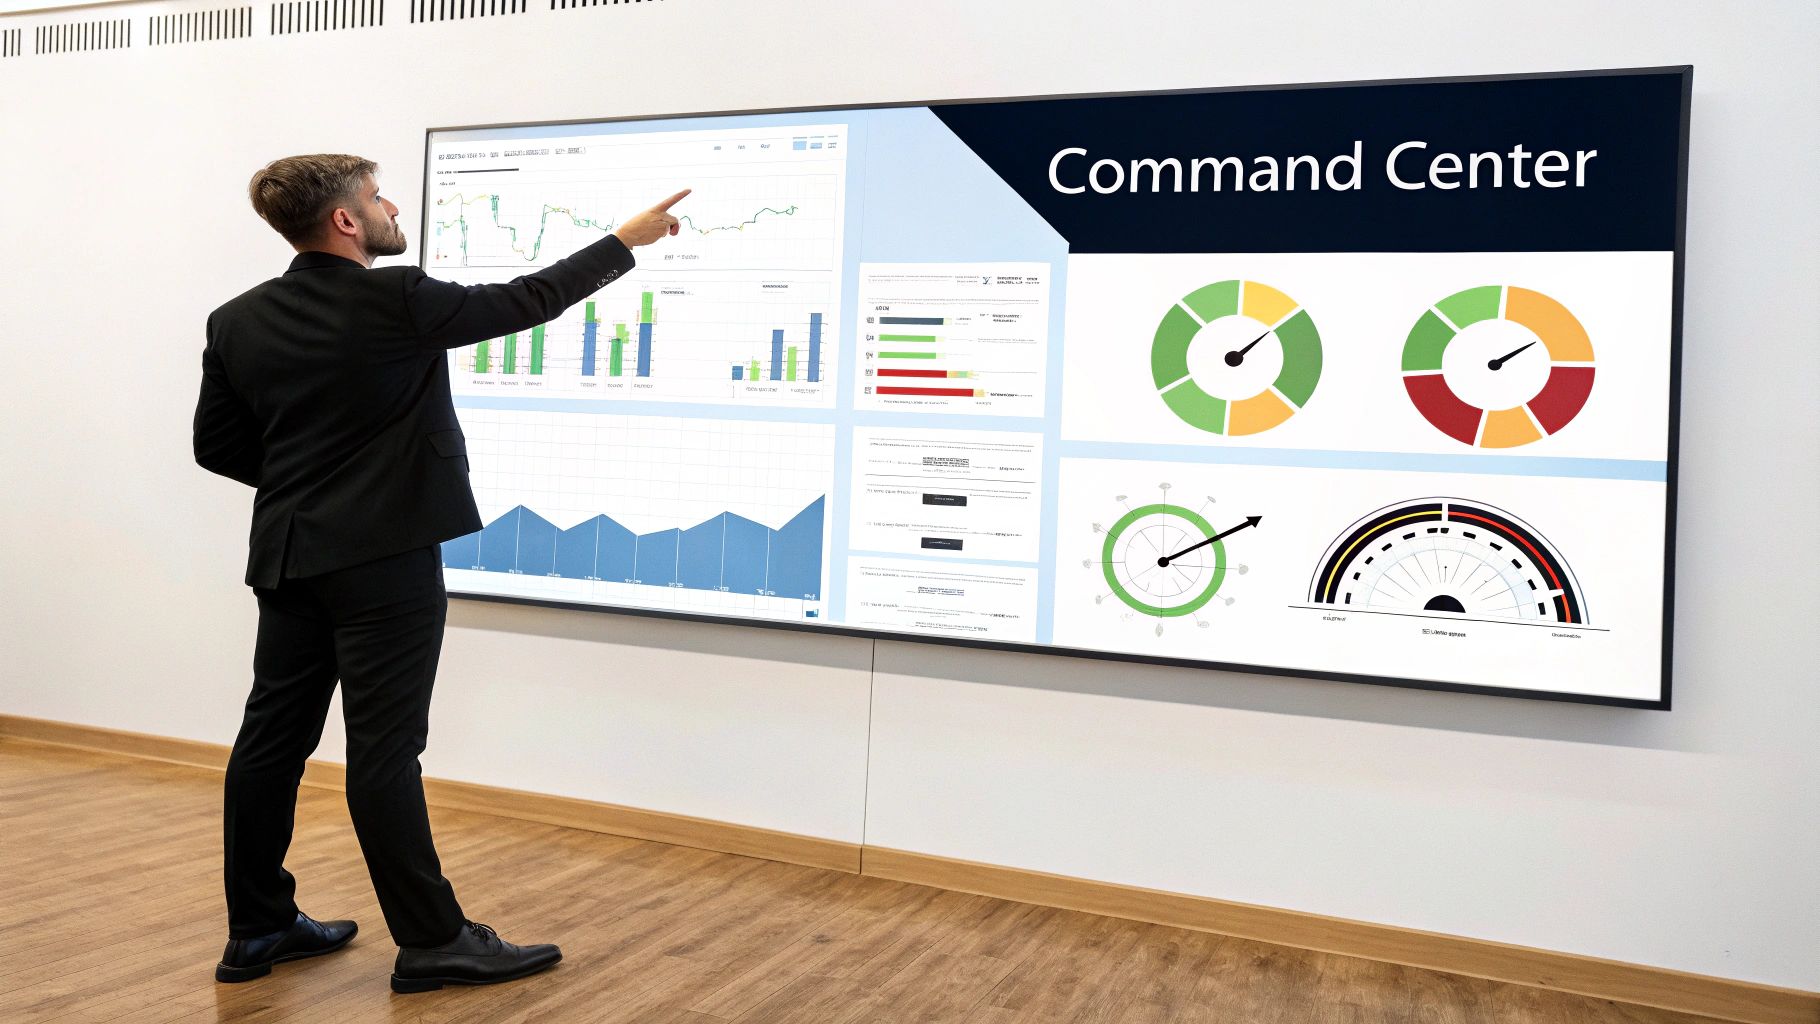
Think of business dashboard reporting as your company's command centre. It takes sprawling, complex data and turns it into a clean, visual story of your performance, updated in real time. It’s about swapping out static spreadsheets for live charts and graphs, helping you track what truly matters and make smarter decisions, faster.
Your Business Cockpit: Why Dashboard Reporting Matters
Would you try to fly a plane with gauges that only updated once a month? It sounds absurd, but that's how many businesses operate—relying on stale reports that are out of date the second they're printed. Business dashboard reporting is the cockpit for your company. It's a living, breathing control panel that feeds you real-time intelligence so you can navigate the market with confidence.
It’s just like your car's dashboard. You don't need to be a mechanic to know what's going on. A quick glance tells you your speed (sales velocity), how much fuel you have left (cash flow), and if the engine is healthy (operational efficiency). This instant feedback lets you react on the spot, whether that means easing off the accelerator, pulling in for fuel, or checking a warning light.
From Guesswork to Growth
For Australian businesses in retail, manufacturing, and logistics, the story is often the same: disconnected systems, endless manual data entry, and decisions made in the rear-view mirror. You might be wrestling with information from your Shopify implementation, a separate accounting program, and a standalone inventory system. This creates data silos, making a clear, unified view of your business’s health almost impossible to achieve.
A study from the KPI Institute found that 68% of companies using KPIs and dashboards saw a tangible improvement in business performance. It’s a powerful reminder of the direct line between seeing your data clearly and actually growing.
Dashboards are the sledgehammer for those data silos. They help you shift from reactive guesswork to proactive, data-backed strategy. This becomes even more powerful when everything is fed from a central hub. An expert Odoo implementation, for instance, can link up all your operations—sales, inventory, finance, production—and pipe live, accurate data straight to your dashboard.
A Practical Case for Retail
Let's picture a retail owner in Sydney running a WooCommerce store. Before dashboards, their week probably involved hours of exporting sales reports, manually matching them against inventory spreadsheets, and trying to decipher trends from a mountain of numbers.
Now, with a connected business dashboard, they see everything at a glance:
- Which products are flying off the shelves right now.
- Current stock levels across every single location.
- The immediate sales lift from a new marketing campaign.
This kind of clarity means they can make quick, decisive moves, like reordering a popular item before it sells out or tweaking ad spend to get the best possible return. To get a feel for how powerful these tools can be, it helps to understand what is Power BI used for and the way it turns raw data into clear, actionable business intelligence.
Ready to build your business’s command centre? As a leading Odoo partner in Sydney and Adelaide, our software development team can help integrate your systems and build dashboards that give you the clarity you need to steer your company forward. Contact Wistec today to get started.
The Essential Metrics To Track On Your Business Dashboards
A powerful dashboard is more than just a collection of attractive charts. Its real value comes from tracking the right metrics—the specific numbers that reveal the health and momentum of your business. Generic key performance indicators (KPIs) can be seriously misleading; to drive real growth, you need to focus on the data that directly impacts your industry's success.
For Australian business leaders, this means moving beyond vanity metrics and measuring what actually moves the needle. Whether you're in retail, manufacturing, or logistics, the right dashboard gives you a practical toolkit for making sharp, informed decisions.
Choosing the right KPIs is fundamental. A retailer cares about cart abandonment, while a manufacturer is obsessed with machine uptime. The table below breaks down some of the most critical metrics across our key sectors.
Key Performance Indicators By Industry
| Industry Sector | Key Performance Indicator (KPI) | Why It Matters |
|---|---|---|
| Retail & eCommerce | Conversion Rate | Measures the percentage of visitors who complete a purchase. It's the ultimate test of your website's marketing, design, and user experience. |
| Retail & eCommerce | Average Order Value (AOV) | Reveals how much customers spend per transaction. Increasing this is a fast track to boosting revenue without needing more traffic. |
| Retail & eCommerce | Customer Lifetime Value (CLV) | Predicts the total profit from a single customer over their entire relationship with you. A high CLV signals strong brand loyalty and retention. |
| Manufacturing | Overall Equipment Effectiveness (OEE) | The gold standard for measuring productivity. It combines availability, performance, and quality into a single score to show how well your machinery is running. |
| Manufacturing | Production Yield | Tracks the percentage of products made correctly the first time. A low yield points to waste in materials, processes, or equipment. |
| Manufacturing | Cycle Time | The total time it takes to produce one unit. Reducing this improves throughput, meets demand faster, and lowers operational costs. |
| Logistics & Supply Chain | On-Time Delivery (OTD) Rate | Measures the percentage of orders delivered by the promised date. It's a direct reflection of customer satisfaction and operational reliability. |
| Logistics & Supply Chain | Inventory Turnover | Shows how quickly your inventory is sold and replaced. A high rate means efficient management; a low rate can signal overstocking or poor sales. |
| Logistics & Supply Chain | Order Accuracy Rate | The percentage of orders shipped perfectly—right items, right quantity, right address. High accuracy minimises costly returns and builds trust. |
As you can see, what you measure is entirely dependent on what you do. Let's dig a little deeper into what these look like in practice.
Core Metrics For Retail And eCommerce
For anyone running an online store in Sydney or Adelaide, profitability lives and dies by understanding customer behaviour and optimising the sales funnel. When we handle a Shopify implementation or build a custom WooCommerce site, our first priority is connecting the systems needed to track these essentials in real time.
- Conversion Rate: What percentage of your website visitors actually buy something? This is the ultimate test of your site’s effectiveness, telling you if your marketing, product pages, and checkout process are working together.
- Average Order Value (AOV): How much does the average customer spend in a single transaction? Pushing this number up with smart upselling or product bundling is one of the quickest ways to boost revenue.
- Customer Lifetime Value (CLV): This forecasts the total revenue you can expect from a single customer over their entire relationship with your brand. A healthy CLV points to fantastic customer loyalty and retention—which is always cheaper than finding new customers.
When setting up your dashboards, it’s all about focusing on what matters most. To get a broader view, you can explore some top ecommerce metrics and KPIs that successful businesses keep a close eye on.
Key Indicators For Manufacturing Success
In manufacturing, efficiency is the name of the game. Every minute of downtime, every piece of waste, and every slow production cycle eats directly into your profit margin. A well-executed Odoo implementation can unify your production, inventory, and quality control data, letting you monitor the metrics that define a lean, productive operation.
A great business dashboard doesn’t just show you data; it tells you a story. It highlights where you're winning, exposes hidden inefficiencies, and points you toward your next best move.
For any manufacturing dashboard, these three KPIs are non-negotiable:
- Overall Equipment Effectiveness (OEE): This is the gold standard for measuring manufacturing productivity. It blends three key factors—Availability (uptime), Performance (speed), and Quality (good parts)—into a single score that paints a clear picture of your machinery's true efficiency.
- Production Yield: A simple but vital metric that measures the percentage of products made correctly the first time, without needing rework. A low yield is a red flag for problems with your materials, equipment, or processes that demand immediate attention.
- Cycle Time: This is the total time it takes to produce one unit from start to finish. Relentlessly tracking and reducing your cycle time allows you to increase throughput, meet customer demand faster, and drive down production costs.
Essential Data For Logistics And Supply Chain
For logistics companies, success is measured in speed, accuracy, and reliability. One delayed shipment or a single incorrect order can shatter customer trust and rack up significant costs. Our software development team in Sydney and Adelaide specialises in building dashboards that give logistics businesses complete visibility over their entire supply chain.
Here are the vital signs of a healthy logistics operation:
- On-Time Delivery (OTD) Rate: What percentage of your orders reach the customer by the promised date? This number is a direct measure of your operational reliability and a massive driver of customer satisfaction.
- Inventory Turnover: This ratio shows how many times you sell and replace your entire inventory over a set period. A high turnover rate is a sign of efficient sales and smart inventory management, while a low rate can mean you’re sitting on too much stock.
- Order Accuracy Rate: This tracks the percentage of orders shipped without a single error—the right items, in the right quantity, to the right address. Nailing this is crucial for minimising costly returns and protecting your hard-earned reputation.
Ready to stop guessing and start measuring what truly matters? As a leading Odoo partner in Sydney and Adelaide, we can help you build a business dashboard reporting system that delivers the specific insights your company needs to thrive.
Contact Wistec today for a free consultation and let's create a dashboard that drives action.
Designing Dashboards That Actually Drive Action
Let's be honest, a dashboard that's just a jumble of charts and numbers isn't a tool; it's a headache. A truly effective dashboard is a decision-making machine. The real magic happens when thoughtful design and a sharp focus on the user transform a confusing report into an actionable, intuitive guide. Great business dashboard reporting cuts straight through the noise, delivering clarity that empowers your team to act with confidence.
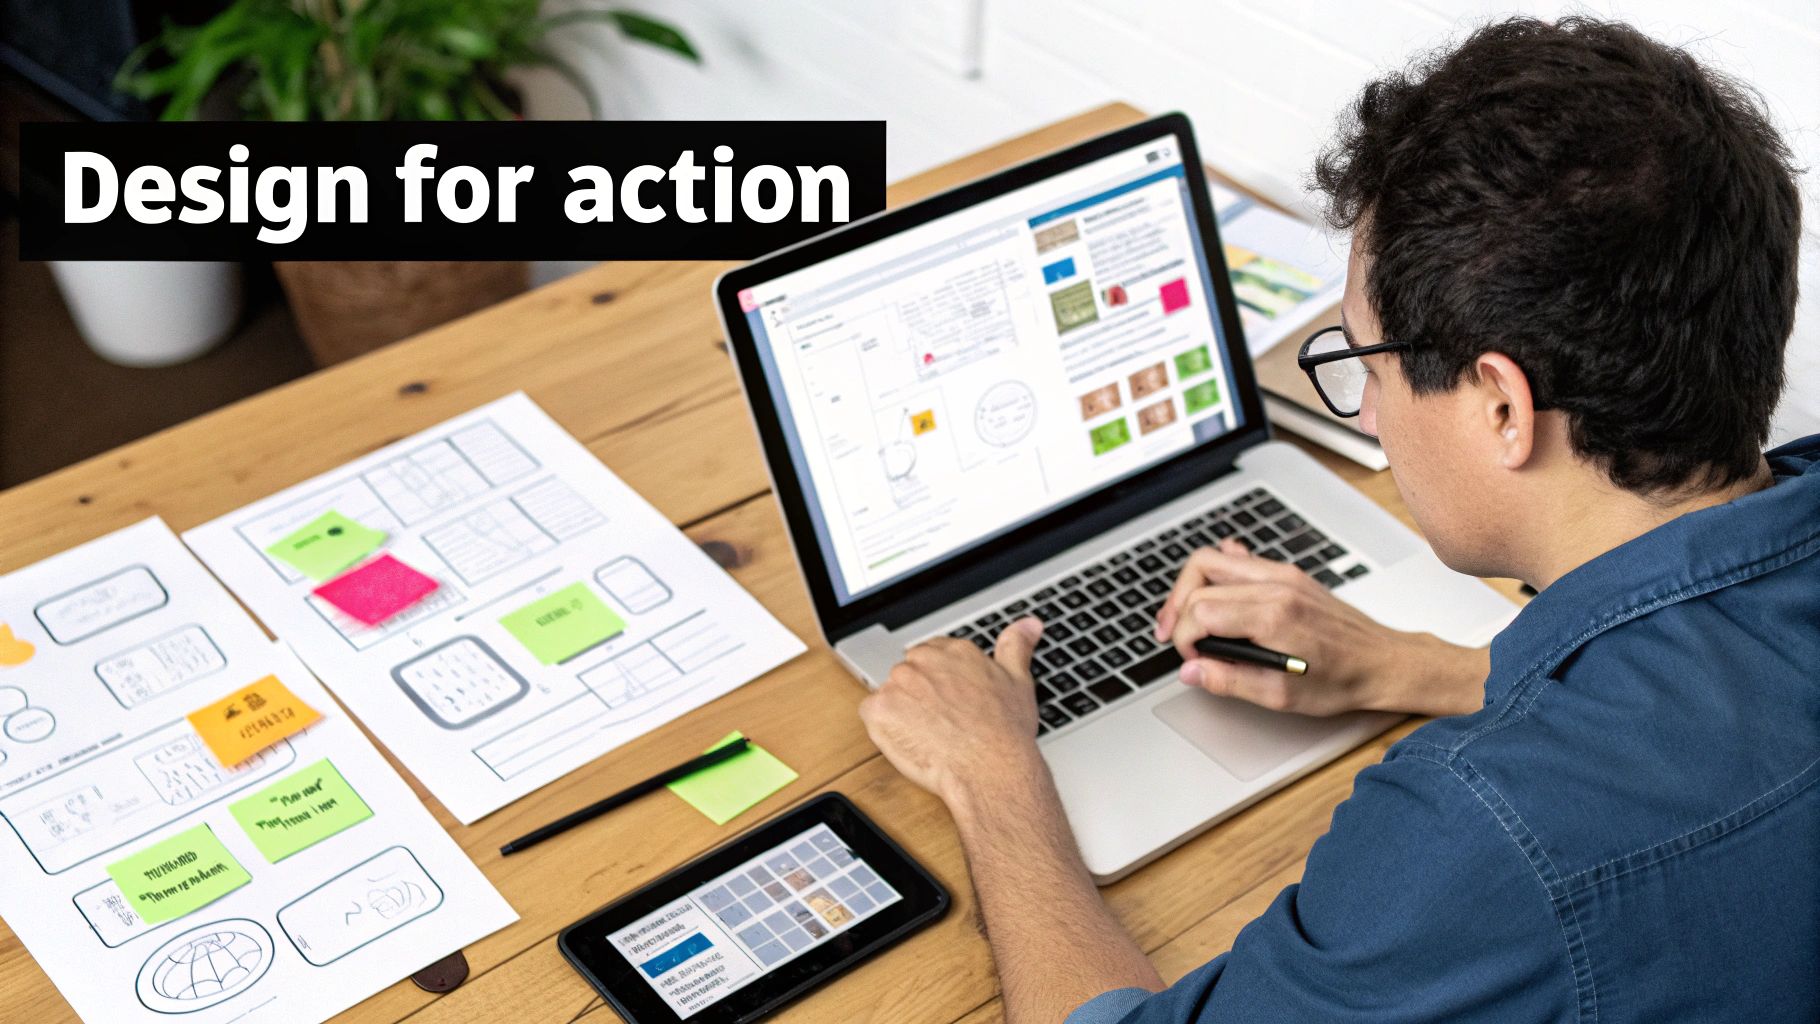
The single most important step you can take? Define your audience. Seriously. A dashboard that tries to serve everyone ends up being useful to no one. You need to think about the different hats people wear in your organisation and design specifically for what they need to see and do.
Tailoring Dashboards to the User
Picture a manufacturing business right here in Adelaide. The CEO needs the 30,000-foot view. They’re thinking about overall profitability, market share, and quarterly production output. Their dashboard has to be clean and concise, highlighting the long-term trends that inform major business decisions.
Now, zoom down to the warehouse floor. The manager there is in the thick of it. They need real-time, operational data at their fingertips—things like pick-and-pack times, current inventory levels for the fastest-moving items, and order accuracy rates right now. A dashboard cluttered with high-level financial metrics is completely useless to them. They need an operational command centre that helps them manage the immediate workflow.
A well-designed dashboard speaks the user's language. It presents the right information, in the right context, at the right time, turning data into a catalyst for intelligent action.
This user-first approach is something we live and breathe. It doesn't matter if we're handling a Shopify implementation for a growing eCommerce brand or a complex Odoo implementation for a logistics firm. Our software development team in Sydney always kicks things off by asking: "Who is this for, and what decision do they need to make with it?"
A Checklist for Effective Dashboard Design
To make sure your dashboards deliver clarity instead of confusion, it pays to follow a few core design principles. This simple checklist will help you sidestep common pitfalls like information overload and build a tool your team genuinely wants to use.
- Choose the Right Visualisation: Don't just throw everything into a pie chart. Use line charts to show trends over time, bar charts for clear comparisons, and big, bold number cards for your most critical KPIs. The goal is to make the data instantly understandable at a glance.
- Create a Clean, Uncluttered Layout: White space is your friend. A good dashboard has a clear visual hierarchy, with the most crucial information placed in the top-left corner where the eye naturally lands first. Let your data breathe.
- Use Colour Strategically: Colour should add meaning, not just decoration. Stick to a limited palette and use it to highlight what matters. Think a simple red to flag a metric that's dropped below its target, or a green for one that's smashing expectations.
- Ensure Mobile Responsiveness: Your key people are always on the move. If a dashboard is a nightmare to use on a smartphone or tablet, it simply won't get used. A responsive design means critical data is always accessible, whether you're in the boardroom or on the warehouse floor.
Practical Case: A Retail Dashboard Makeover
We worked with a retail business using WooCommerce in Sydney whose old dashboard was a perfect example of what not to do. It was a chaotic mess of 20 different charts crammed onto one screen. It was so overwhelming that managers just ignored it.
Our solution was to redesign it based on roles. The marketing manager now has a dedicated dashboard showing campaign ROI, conversion rates, and customer acquisition costs. At the same time, the inventory manager gets a separate view focused entirely on stock turnover, sell-through rates, and supplier lead times.
The result was immediate. Engagement shot through the roof because the information was finally relevant. Managers could see the direct impact of their actions, leading to smarter, faster decisions about everything from marketing spend to stock reordering.
As a leading Odoo partner in Sydney and Adelaide, this is what we do. We don't just connect your data; we design and build dashboards that truly empower your team by structuring information visually to drive the actions that matter most.
Ready to transform your data into a decision-making powerhouse? Contact Wistec for a consultation today.
Getting Your Data in One Place: The Single Source of Truth
The biggest hurdle to making sharp, decisive calls isn't a lack of data. It's that your data is all over the place.
When your sales figures are locked in one system, your inventory in another, and your financial records in a third, you’re flying blind. For many businesses, this is the daily reality. Isolated pockets of information, or "data silos," make it impossible to get a unified, accurate view of the entire operation.
This disconnect is a massive drain on time and a breeding ground for costly mistakes. It forces your team to spend countless hours manually exporting spreadsheets and stitching together reports, trying to build a picture that’s already stale by the time it’s finished. Truly effective business dashboard reporting can only happen when it’s fed by a single, reliable source of information.
The Power of a Central Hub
To get that genuine 360-degree view, you need a central nervous system for your business—one place where all your operational data flows together seamlessly. This is where a solid Enterprise Resource Planning (ERP) system becomes non-negotiable. Think of it as the ultimate "single source of truth."
A single source of truth ends the debate over which numbers are right. When everyone from the warehouse floor to the boardroom is looking at the same real-time data, you align your entire organisation around one version of reality.
As an expert Odoo partner in Sydney and Adelaide, we specialise in creating this central hub. A well-executed Odoo implementation breaks down the walls between your departments. It connects all your separate systems—like your Shopify implementation, accounting software, CRM, and manufacturing controls—into one cohesive database. This integration is the bedrock on which powerful, trustworthy dashboards are built.
A Real-World Example: Unifying a Retailer’s Operations
Picture a growing retail business with physical stores in Sydney and an online shop running on WooCommerce. Before we stepped in, their situation was chaotic. The eCommerce team could see sales data but had no live view of in-store inventory. The warehouse team knew stock levels but couldn't see which products were flying off the virtual shelves. And every month, the finance team would spend the first week just trying to make sense of it all.
By implementing Odoo as their central ERP, we completely changed the game.
- Connecting the Storefront: We integrated their WooCommerce site directly with Odoo. Now, every online sale instantly updates inventory levels across the whole business.
- Unifying Financials: Their accounting module was synced up, meaning revenue, costs, and profit margins were calculated automatically, in real time.
- Linking Inventory and Sales: The new dashboard visualises the entire customer journey. They can see which marketing campaigns are driving online sales, how those sales affect stock levels in specific locations, and the precise profitability of every single product.
This holistic view was once a pipe dream. Now, they can confidently make decisions about stock transfers, promotions, and purchasing based on a complete and accurate picture of their business health. This is the core value our software development Sydney Adelaide team delivers.
Taming Data Chaos in Australian SMBs
This challenge of juggling multiple, disconnected systems is incredibly common. In fact, small and medium businesses (SMBs) across Australia are increasingly turning to business dashboard reporting to manage this complexity. Research shows a staggering 82% of leaders believe it would dramatically lift productivity, while 80% see the potential for significant revenue boosts.
With over 2.6 million actively trading businesses in Australia—a massive 97.2% of which are small businesses—the scale of this opportunity is huge. These SMBs often find themselves juggling an average of seven different apps. This inevitably leads to data inconsistencies and a feeling of being completely overwhelmed, which is precisely the problem a unified dashboard solves. You can read more about these small and medium business trends from Salesforce and see just how vital data unification has become.
This shift towards integrated data isn't just a fleeting trend; it's a fundamental change in how successful businesses operate. By creating a single source of truth, you eliminate the guesswork and empower your team to make smarter, faster decisions based on the complete story.
Ready to break down your data silos and build a dashboard powered by a single source of truth?
Contact Wistec today for a consultation on a custom Odoo implementation that will unify your operations.
Your Step-By-Step Business Dashboard Implementation Plan
Let’s be honest: moving from messy, scattered data to a single, clear command centre can feel like a huge task. But it's a structured journey, not a blind leap of faith. Building an effective business dashboard reporting system is all about demystifying your operations, and success comes down to a deliberate, phased approach.
Think of it like building a high-performance race car. You wouldn't just start welding pieces together without a detailed blueprint, right? The same principle applies here. A methodical plan ensures your finished dashboard isn't just a pretty collection of charts, but a genuine tool for growth that’s perfectly tuned to your business goals.
This roadmap breaks the entire process down into manageable stages, guiding you from the initial idea all the way to a successful company-wide rollout.
This visual shows the core phases of a successful dashboard plan from initial strategy to final design.
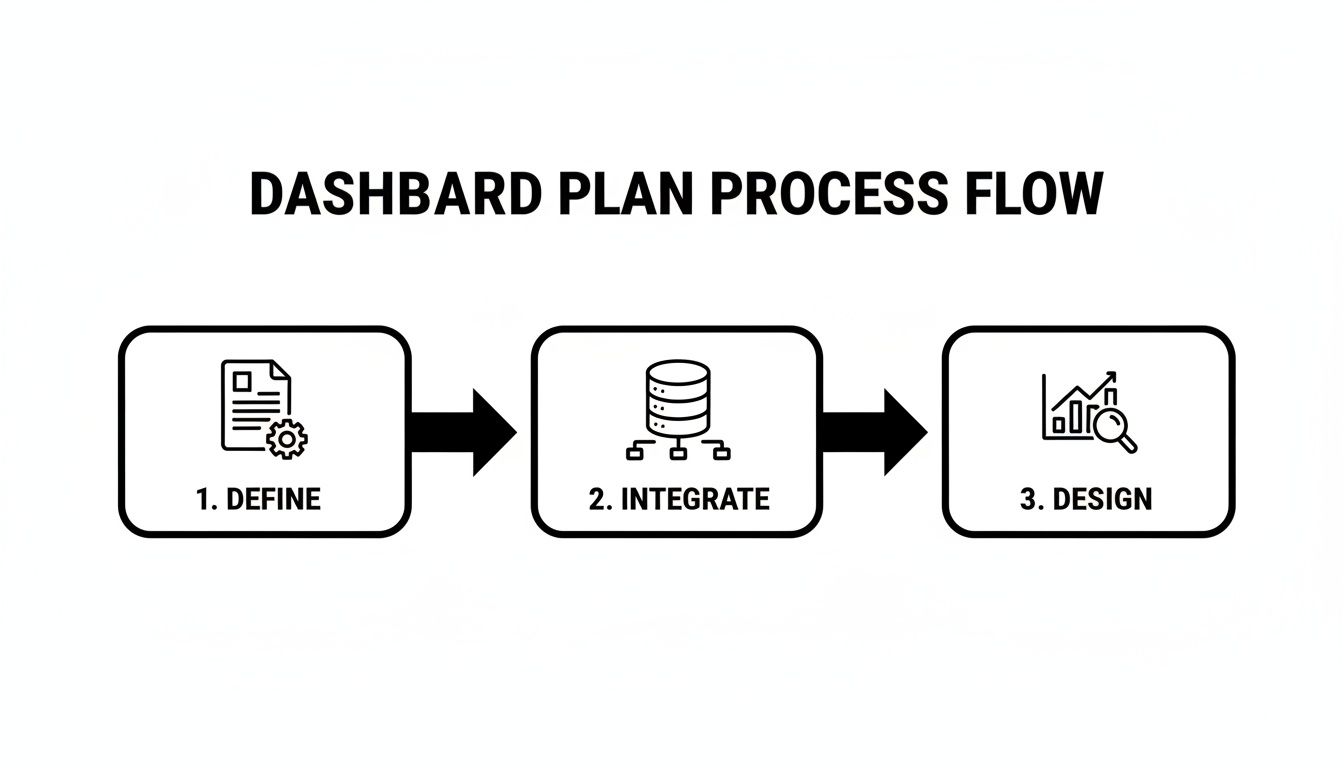
The flow from defining objectives to integrating data and finally designing the interface underscores that a great dashboard is built on a solid strategic and technical foundation.
Phase 1: Define Your Objectives and Stakeholders
Before you even think about charts and colours, you need to answer two absolutely fundamental questions: "What are we actually trying to achieve?" and "Who needs this information to do their job better?"
Your goals have to be specific and measurable. Are you trying to boost your sales conversion rate by 15%? Or maybe you need to slash your manufacturing cycle time or nail down your on-time delivery rates. Get specific.
Identifying your key stakeholders is just as crucial. The metrics a CEO cares about are worlds away from what a warehouse manager or a marketing lead needs to see. By bringing these end-users into the conversation from day one, you ensure the dashboard solves their real-world problems. This turns them into champions of the project, not roadblocks.
Phase 2: Select Your Tools and KPIs
Once you have clear objectives, you can pinpoint the Key Performance Indicators (KPIs) that will accurately track your progress. If your goal is to grow online sales, your dashboard must feature metrics like conversion rate, average order value, and cart abandonment rate. These are the gauges in your cockpit; they tell you if you're on course.
Choosing the right technology comes next. While standalone BI tools are an option, we’ve found the most powerful dashboards are often built directly within a central ERP. An Odoo implementation, for example, has robust, built-in dashboard capabilities that pull directly from your unified operational data. This means you get accurate, real-time insights without needing to patch together complex integrations—a core strength our software development Sydney Adelaide team delivers.
A successful implementation isn’t just about technology; it’s about aligning that technology with human decision-making. The goal is to build a tool that feels like a natural extension of your team’s workflow.
Phase 3: Plan Data Integration and Design
This is where we lay the technical foundation. Your implementation partner will map out exactly how to connect all your different data sources—like your Shopify implementation or WooCommerce store—into your central system. This creates that critical single source of truth. A clean, reliable data pipeline is completely non-negotiable for a dashboard you can trust.
At the same time, the design process kicks off, following user-centric principles of clarity and simplicity. This involves creating wireframes and mockups that focus on a logical layout, strategic use of colour, and choosing the right chart types to make complex data instantly understandable. This phase ensures the final product is both powerful and intuitive to use.
Phase 4: Train Users and Drive Adoption
Finally, even the most brilliantly designed dashboard is worthless if nobody uses it. This last phase is all about user training and encouraging company-wide adoption. This is more than just a quick tutorial video. It’s about showing people how the dashboard solves their specific problems and genuinely makes their job easier.
We create training sessions tailored to different teams, showing them how to interpret the data that matters to their roles and make smarter decisions with it. It’s also important to celebrate early wins publicly to build momentum and excitement. When your team starts to see the dashboard as an indispensable tool for their success, you know you've achieved a true return on your investment.
As a leading Odoo partner in Sydney and Adelaide, we guide businesses through every single stage of this implementation plan.
Ready to build a business dashboard that delivers real results? Contact Wistec today to start your implementation journey.
The Future of Business Dashboard Reporting
Let's be honest, business reporting used to be all about looking in the rearview mirror. It was a history lesson on what had already happened. That's changing, and changing fast. The future of business dashboard reporting isn't about asking 'what happened?'; it's about asking 'what should we do next?'. It's a shift from history reports to a strategic roadmap, giving you the power to make decisive, forward-looking moves.
This isn't just a fantasy. We're already seeing trends like AI-powered predictive analytics being baked right into modern dashboards. Picture this: your dashboard doesn't just show you last quarter's sales. It actively forecasts next quarter's trends based on live data and even flags a potential supply chain bottleneck before it grinds your operations to a halt. This kind of proactive insight is quickly becoming non-negotiable.
Why Getting on Board Now is Crucial
The engine powering these tools—the Australian data analytics market—is absolutely booming. It's set to skyrocket from USD 1.1 billion in 2024 to an incredible USD 7.5 billion by 2030. What's fuelling this fire? A massive demand for predictive insights, especially in ERP and supply chain management. This isn't just a trend; it's a clear signal of where the market is heading. Businesses that embrace intelligent reporting now will set the pace, while laggards will be left playing catch-up. You can dig into the numbers yourself and read more about Australia's booming data analytics market on Grand View Research.
This is precisely where we live and breathe. As a leading Odoo partner in Sydney and Adelaide, our custom software development and expert Odoo implementation services are all about equipping you with this future-proof intelligence. It doesn't matter if you're running on Shopify or WooCommerce; we build systems that don’t just tell you where you've been—they prepare you for what's coming next.
Ready to stop looking back and start planning ahead? Contact Wistec today to build a dashboard that drives tomorrow's success.
Answering Your Questions About Business Dashboards
Diving into a business dashboard project naturally brings up a lot of questions. If you're going to invest time and money, you want to be sure it’s going to pay off. Let's walk through some of the most common queries we hear from business owners just like you.
First up, the big one: "How long is this going to take?" Honestly, it depends. A simple Shopify implementation for a single e-commerce store could be live in just a few weeks. But if we're talking about a full-blown Odoo implementation for a Sydney-based manufacturer, linking everything from the factory floor to finance, you’re looking at several months. The most important thing is having a clear, staged plan from the very start.
What's the Biggest Roadblock in a Dashboard Project?
It’s almost never the technology itself. The real challenge? The data. So many businesses we meet have their information locked away in separate systems, often with inconsistencies that make a single, clear picture impossible. This is precisely where a good Odoo partner in Sydney or Adelaide proves their worth.
Our first job is always to establish a ‘single source of truth’. That means getting our hands dirty with data cleansing and integration, making sure the numbers from your WooCommerce store match what's in your accounting system. If you skip this step, your shiny new dashboard will just be a prettier version of the same old confusion.
How Can We Get Our Team to Actually Use It?
This is the million-dollar question, isn't it? A dashboard is useless if no one looks at it. The key to getting your team on board is to make it personal and incredibly relevant to their daily work. We don't build one-size-fits-all solutions; we sit down with your people—from the sales team to the warehouse manager—to build something that solves their problems.
A dashboard that helps a sales manager instantly see their team's performance or allows an inventory manager to prevent a stockout becomes an indispensable tool, not just another report.
Our software development team in Sydney and Adelaide is obsessed with creating interfaces that just make sense. When the tool is intuitive and directly helps someone do their job better, it stops being a chore and becomes a core part of how they work. That's how you get real adoption and drive smarter decisions across the entire organisation.
Are you ready to turn your scattered data into your most powerful asset? The team at Wistec specialises in building business dashboard reporting solutions that give you the clarity you need to grow with confidence. Whether it's a deep ERP integration or a targeted dashboard for your online store, we deliver technology that gets results.